A high quality asset can be a poor investment if acquired at an obscenely high valuation (versus its intrinsic value). On the other hand, even an average asset can be a great investment if acquired at a low valuation. Hence, valuation plays an extremely important role in determining investing outcomes.
How does one assess if valuation is high or low? While discounted cash flow is the ultimate method, it is full of assumptions, which makes it tricky to use for most people. Amongst short-cuts, the most common is to simply see what is the multiple one is paying on the profit, which is nothing but Price-Earning or PE multiple.
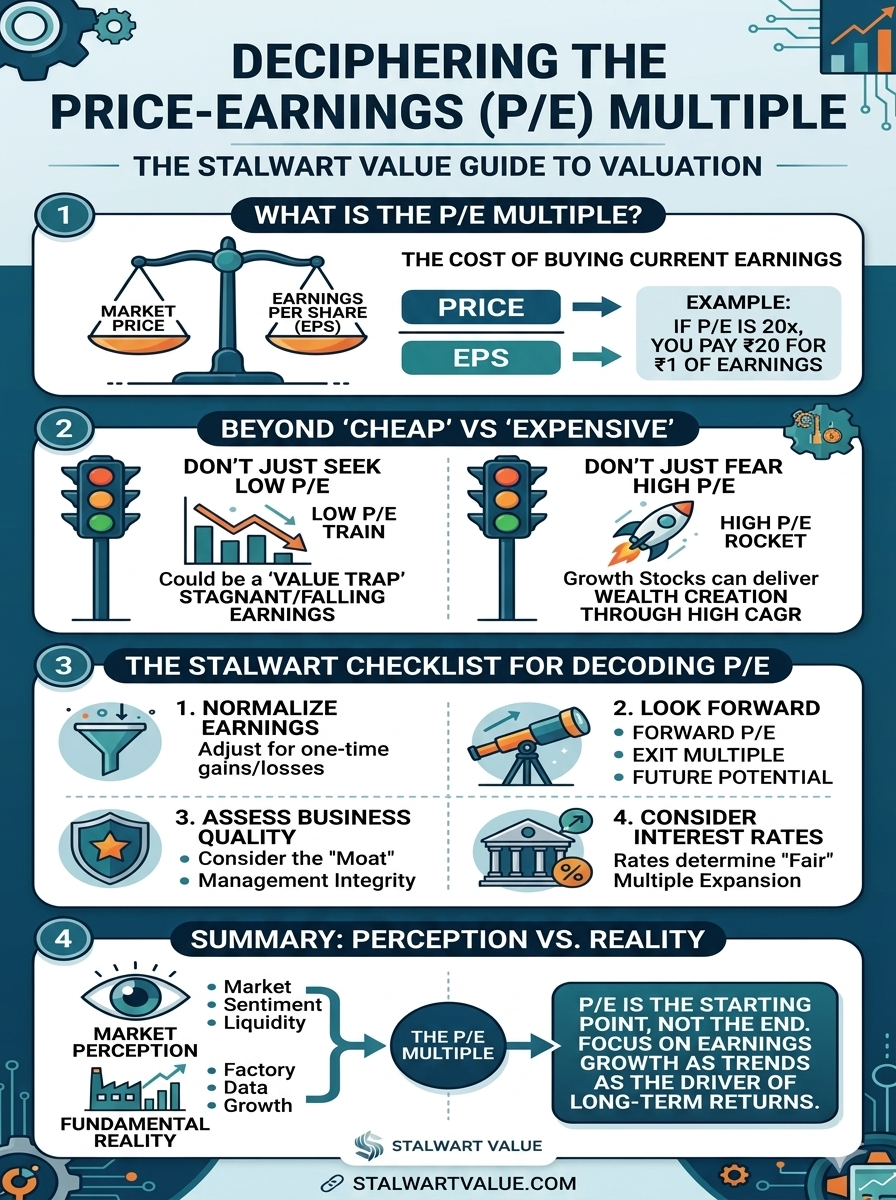
For example, if Airtel had an earnings per share (EPS) of Rs 10, and its stock price is Rs 200, it is trading at a PE multiple of 20 (or 20x). It will take us 20 years to recover our invested capital, assuming the EPS stays the same and company pays everything out as dividends, which is nothing but the payback period. Naturally, any investor would prefer a lower payback period, implying lower the PE, more lucrative would be the deal? To be able to answer this, let us first understand four nuances of PE.
Nuance 1: Reported PE is of the past, what matters is the future
The reported PE is always last year’s earning, whereas what matters is what would be earnings going forward. Two companies, let us assume Airtel & Voda, are hypothetically trading at a PE of 20x, are they equally expensive? What if Airtel is likely to grow its earnings by 10% next year whereas Voda is likely to face a 10% drop in its earnings? In that case, Airtel is actually at a forward PE of just 18x whereas Voda is trading at a forward PE of 22x. Hence, our view of where EPS is going matters more than reported EPS of last year.
There could be companies which faced an exceptional loss (non-recurring) during previous year, due to reasons like a labour strike, fire incident, product-recall etc. Due to depressed denominator (EPS) their reported PE may look optically high but the forward PE on normalised earnings might just seem reasonable.
There could also be companies which posted a loss during last year; with a negative EPS the PE will be negative and likely to serve no purpose. In this case as well, the forward PE on normalised EPS might just seem reasonable.
Nuance 2: PE’s Absolute vs Relative Significance
HDFC AMC is at a PE of 35, is it expensive or cheap? It is difficult to answer that question in isolation, so let us start with relative valuations to be taken up in three parts:
2.1 HDFC AMC Vs. Market (Sensex)
Sensex consists of top 30 Indian companies from diverse sectors and can be used as an indicator for the market aggregate. This index is trading at a PE of 20x while offering an EPS growth of 10% (quantum of growth) at an RoE of 15% (quality of growth).
In contrast, HDFC AMC has been growing at over 20% CAGR (twice that of Sensex) at an RoE of 30-35% (twice that of Sensex). When seen in this context, HDFC AMC’s premium on Sensex’s PE seems justified for the quantity & quality of growth it offers. How much premium is subject to debate and assumptions on expected trend of growth & quality (RoE), however we can agree that it deserves a premium.
2.2 HDFC AMC Vs. Peers
No two businesses are same, even if they belong to same industry and optically does the same thing. Hence, PE comparisons need to adjust not only for growth profile but also the quality of growth, quality of balance sheet, quality of management among various other parameters.
A peer like ICICI AMC at 48x could be cheaper than HDFC AMC, whereas another peer like UTI AMC at 17x could be expensive. Absolute PE multiple doesn’t reveal much, otherwise it would have been simpler to automate investing via AI.
2.3 HDFC AMC Vs. Itself
How does the current PE of 35 look versus the historical PE multiple?
If historical average has been 30, is it expensive at 35x? This exercise needs to account for positive/negative changes in the trajectory:
Has the business model/regulatory framework gotten stronger to deserve a higher multiple? Has the market share expanded?
Has the growth accelerated?
Has the RoE expanded on higher growth?
Has the cash flows/payouts gotten stronger?
Similarly, if historical average was 40, is it cheaper at 35x? And we will ask the same questions as above but to find out if they have gotten weaker.
Nuance 3: PE for Commodity Businesses – Low could imply more risk
Businesses dealing in commodities, like those pumping Crude (upstream) will post bumper earnings over next few quarters, making their reported PE look low & desirable, when in reality the best could be behind. Whereas in times when Crude was trading at depressed price, of say less than $60, the reported EPS would also be depressed making PE look optically high and undesirable, when in reality it could be good time to evaluate. This is true for all commodities be it cement, ferrous metals (iron & steel), non-ferrous metals (copper, aluminium, zinc etc), precious metals (gold & silver), energy (coal, crude, renewables), base chemicals, glass, paper, agri products like rice, rubber, tea & coffee, among others.
Nuance 4: Growth & terminal PE over starting PE
A EPS of Re 1 & PE of 50, can still prove be a good investment, if not only growth is high but there is longevity of high-growth period. If EPS grows at 40% CAGR for 5 years, Re 1 of EPS will become Rs 5.4 by 5th year. At a terminal (exit) PE of 25, the stock will be Rs 135 returning an impressive 22% CAGR.In this case, PE de-rated from 50x to 25x, and yet stock delivered more than satisfactory returns, as EPS growth more than made up for the valuation de-rating.
While PE looks simple on the surface, it comes with its own set of nuances. No tool is complete in isolation. We often use multiple valuation methods, alongside PE, to validate our assessment. The other valuation ratios we use include price-sales, price-book, replacement cost, EV-EBITDA, dividend yield among others.
Disclaimer: We like writing & explaining our thought-process as it forces us to think deeper and improve our own clarity. Investing concepts are best explained using real businesses rather than made-up X & Y. The company names are purely for illustration/educational purposes and in no way imply actual views. We don’t have any holdings in the stocks mentioned above. Please do your due diligence before acting on it.
Source:
This is an excerpt from Partners’ Memo FY26 by Wealth Guardian Fund of Stalwart PMS. The complete memo along with prior editions can be found on the following link: https://stalwartvalue.com/investor-memos/
Leave a Reply