A lot of us have the quest to unearth those high-quality stocks which will create wealth for us, but how do we figure out which are those 15-20-25 stocks worthy of being in our portfolio from over 7,800 stocks listed on the Indian stock exchanges?
Looking for the ‘right’ stocks from this vast universe is akin to looking for a needle in a haystack, you often end up wasting too much time with not so satisfactory outcome. As minority investors, it is difficult to conclude with any degree of confidence that a specific company is high-quality, which is often an abused term to just refer to a bunch of stocks which recently outperformed the markets like small-caps in 2017 or large-cap consumer stocks in 2019.
But how about we turn the question on its head and instead identify the ‘wrong’ stocks which we must avoid? Stocks where we can lose our capital permanently? Stocks where we can pinpoint to something evidently questionable and conveniently filter them out – Business models which are getting obsolete or disrupted and are doomed to fail, over-leveraged balance sheets leading to solvency risk, businesses run by crooked managements with shaky corporate governance and so on and so forth.
Inversion is a powerful tool and advocated by one of the wisest investors in the world – Charlie Munger. By eliminating the obvious bad stocks, we would automatically be left with an ‘Investable Universe’ which is essentially following the premise ‘innocent until proven guilty’. We call this Stalwart Advisors’ Universe (SA’s Universe).
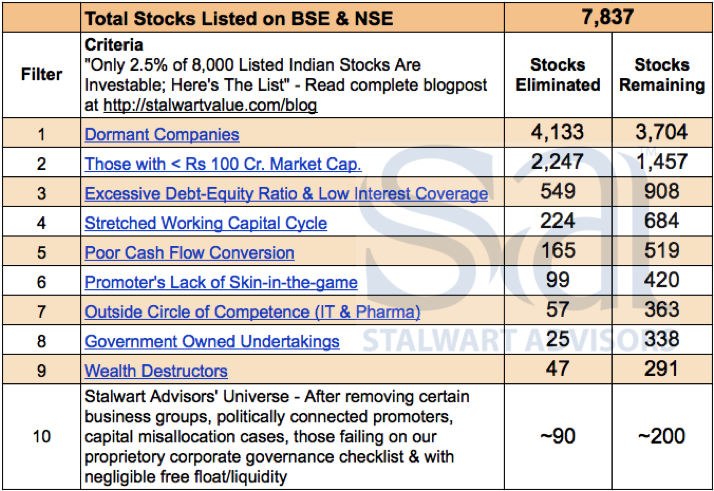
The idea behind this post is to show step by step how we, at Stalwart Advisors, follow this elimination process and ultimately arrive at the investable universe from which we make most of our bets. At the end of the post, you would find a google sheet link with the final list of stocks and stocks eliminated at each stage (except the last filter).To begin with we have a gigantic list of 7,837 stocks listed as per Ace Equity:
- Dormant Stocks: If we remove the ones that have not traded in October, the list will contract by 50% leaving behind 3,704 actively traded stocks.
- Nano Caps / SME: We then remove tiny businesses with a market capitalization of less than Rs 100 Crores; they operate at a small scale with a negligible float. The majority lack professionalism & transparency desired by us as minority shareholders. At this stage, we are left with 1,457 stocks.
- Solvency Risk: The biggest reason for corporate failure is leverage. So let’s filter out the ones with weak balance sheets – debt-equity ratio of more than one or interest coverage of less than three. Down to 908 stocks.
- Stretched Working Capital: Businesses with gross working capital (receivables days + inventory days) of over 135 days not only face growth issues but are fragile too. Now left with 684 stocks.
- Missing Cash Flows: Sales are vanity, profits reality, and cash sanity. We remove companies that have not been able to convert reported profits to cash – cumulative operating cash flow across the cycle below 50% of cumulative operating profit. 519 stocks remain.
- Lack of skin-in-the-game: Businesses where promoter’s stake is less than 40% or he has pledged more than 15% of his stake. 420 stocks meet this criterion.
- Outside Circle of Competence: We remove companies from two sectors – Pharma & IT, as that falls outside circle of competence of most investors. Down to 363 stocks.
- Misaligned Interest with Minority: All state & central government-owned companies whose real motive isn’t sustainable profit but either controlling natural and strategic resources or redistribution of wealth etc. This leaves us with 338 stocks.
- Wealth Destructors: Cycle average return on capital employed less than cost of capital (12%) implying wealth destruction. 291 stocks make the cut.
- Certain Business Groups, Capital Misallocation, Corporate Governance Red Flags & Negligible Float/Liquidity: In this last step we remove another bunch of stocks belonging to certain business groups with whom we don’t prefer to partner as minority shareholders, those run by politicians or politically connected persons, those which fail on our proprietary corporate governance checklist, having poor track record of capital allocation and ones with negligible free-float/liquidity. Down to about 200 stocks.
From this exercise, we have eliminated 97.5% of the listed companies and ultimately left with about 200 stocks which are almost our entire investable universe. If that still seems like a wide universe to track, you can make the filters slightly more rigorous like increasing RoCE hurdle from 12% to 15%, gross working capital days from 135 to 120, market cap threshold from Rs 100 Cr. to Rs 500 Cr. and you would have further reduced the universe to just about 100 stocks.
The next stage of research is much more rigorous and involves deep dive in each of these companies and sectors individually. Each company-specific research would aim to address questions like:
- Is the sector to which this company belongs enjoying tailwinds or facing headwinds? How is the technological disruption affecting the prospects of this industry? How is this company placed versus the competition?
- Is the management competent and ambitious enough to take the business to the next level? Are they investing in building capabilities and manufacturing capacities? Do we see earnings per share growing at 15-20% CAGR over the next 3-5 years?
- What would be the right metric to value this business? What would be a fair valuation range? Is there a margin of safety at the current price?
It is important to clarify that we aren’t suggesting these 200 stocks are ‘high quality’, rather what we are saying is that they aren’t optically ‘bad’ based on currently available information, which is very different than saying all of them are high quality.
Putting together a portfolio of 15-20 stocks from this filtered lot and making money is still going to be as much luck as skill. Investing is betting on the future which obviously nobody can foresee, making it all probabilistic. There are so many moving parts that even promoters themselves can’t figure out what’s going to happen next quarter, leave alone analyst projections for 2025. For equity investors there is an added layer of uncertainty beyond projecting earnings, which is that of how would market value that earning stream a few years down the line – a big driver of stock returns, after all, is valuation (price-earnings) re-rating or de-rating which is even more challenging to project than earnings.
Notes & Exceptions
- Institutionally owned & professionally run companies like ITC, CARE or MCX would move out during skin-in-the-game filter as there is no promoter. Similarly, at this stage some large caps; most of the banks & NBFCs also get eliminated as promoter holding is less than 40%.
- Circle of competence would differ from investor to investor, we have removed companies from Pharma & IT as these need domain knowledge to be able to imagine the future under evolving technological disruption. For some, it could be some other sectors like Real Estate, Capital Goods or Specialty Chemicals.
- Each investing style involves different kinds of variables, most of the turnarounds may not appear in our final universe. We are long-horizon investors who like to identify profitable businesses with lean balance sheets, healthy operating cash flows and run by owner-operators with skin-in-the-game and hence you see majority filters around these.
- We haven’t put any filters around valuation and growth as that would keep changing and involves a lot of subjectivity and perspective. Hence, those are better judged at the individual company level. For readers’ quick reference, we have added data around valuation and growth for 291 companies (until filter 9) in the attached Google Sheet.
- Two-thirds of our current invested portfolio falls under this universe, with some smaller positions in select turnaround and cyclical opportunities that meet other crucial filters like balance sheet health, promoter’s skin-in-the-game, and corporate governance checklist, etc.
Click here to access the Google Sheet
Disclaimer: The post is for information purposes only and not to be construed as investment advice. Stalwart Advisors and its clients may have a financial interest in the companies mentioned. Please consult your financial advisor before acting on any of it. Data is sourced from Ace Equity, for additional disclaimers around data compilation and exceptions, please refer to google sheet.
Leave a Reply to Debaprasad Nanda Cancel reply